Capstone (FYP): inlingua School of Languages

Topic: Enhancing inlingua Language School Management System
Role: System Engineer
Summary: Worked in a team of 6 to improve business processes of a language school by introducing data analytics and reducing their manual workflow inefficiencies
Responsibility: In charge of the whole data analytics part of the project
Tools: Python, AMPL, Tableau, d3 JavaScript
Problem 1: To find out if the school should have more courses opened for certain languages at certain periods of the year
Problem 2: To optimize timetable scheduling (maximize classroom utility) and automate the scheduling process
Background: inlingua School of Languages in Singapore offers full-time and part-time language courses, corporate and individual tuition in 16 different languages. They also have global presence with 324 language centres in 37 countries across Europe, Africa, Asia, North and South America as of 2018. There is an absence of data analytics (problem 1) and this project also aims to reduce manual efficiencies in the workflow (problem 2).
For Problem 1:
Using Tableau and Python, initial analysis is able to show the popularity of different language courses at different times of the year, using student hours as a proxy for popularity.
Using Python, a Seasonal AutoRegressive Integrated Moving Average with eXogenous regressors (SARIMAX) model was used to predict student hours for popular language courses that follow a seasonal trend, with the performance metric being the root mean squared error of the predictions with the actual student hours.
Using D3.js, student hour forecasts for different languages across time was visualized on an interactive plot, and was further integrated into the Admin Portal.
For Problem 2:
Using AMPL, the scheduling optimization problem was coded out and solved with Gurobi solver, a commercial solver for integer programming. Hard and soft constraints were used to allow flexibility in the optimization model.
Using Python, the optimal timetable output was visualized on a Gantt chart, and was further integrated into the Admin Portal.
This scheduling process, which was previously done manually and on a weekly basis, is now automated with additional smart algorithms to maximize classroom utility levels, generated on a weekly basis.
Hover over thumbnail to enlarge image, click to open in new tab

1. Interctive d3.js Student Hours graph with predictions

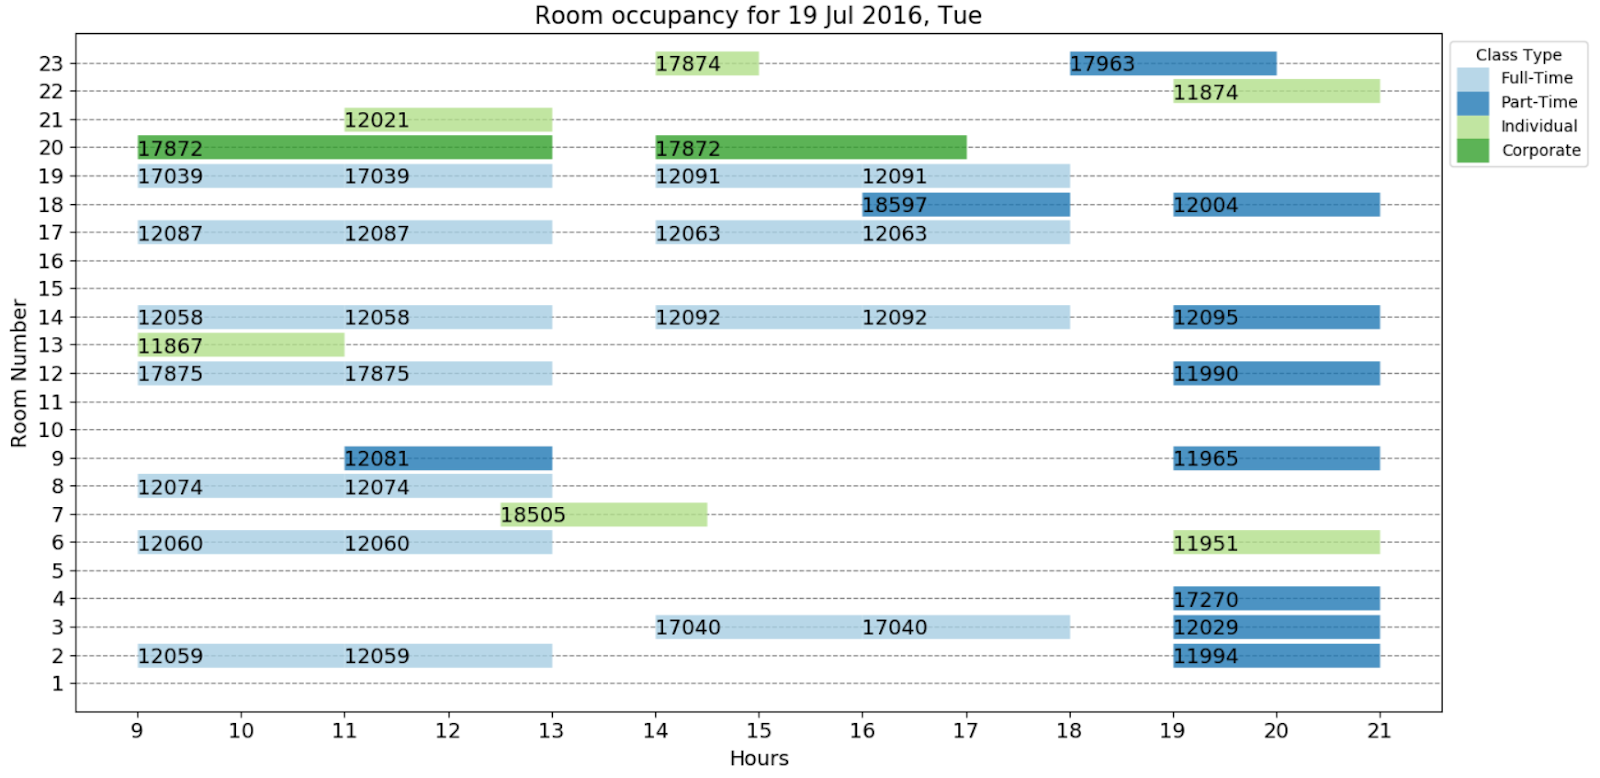
2. Sample Output Timetable for one day

Network Modelling: Singapore Bus Service (SBS)

Topic: SBS Network Model
Role: Project Leader
Summary: Led a team of 4 to find out relationship between the bus services in Singapore given a network model
Tools: Python, R
To find out relationship between the bus services in Singapore given a network model
Background: Undirected graph with nodes representing bus numbers and weight of edges representing the number of common bus stops between buses. There are 322 nodes (buses) and 8958 edges.
Using Python, initial analysis is able show the different centrality (level of importance) of the network; degree centrality, eigenvector centrality, katz centrality and betweenness centrality. From the top 5 ranking of each centrality, there were only 9 unique bus numbers.
Using R, an interactive network, as shown below, is churned out with only the 9 unique bus numbers. It can be noticed that they are very interconnected.
Using Python, further information can be extracted regarding degree distribution, diameter (longest shortest path), path, modularity (degree of clustering of nodes) and cliques. View the photos below to know more about the results.
Hover over thumbnail to enlarge image, click to open in new tab
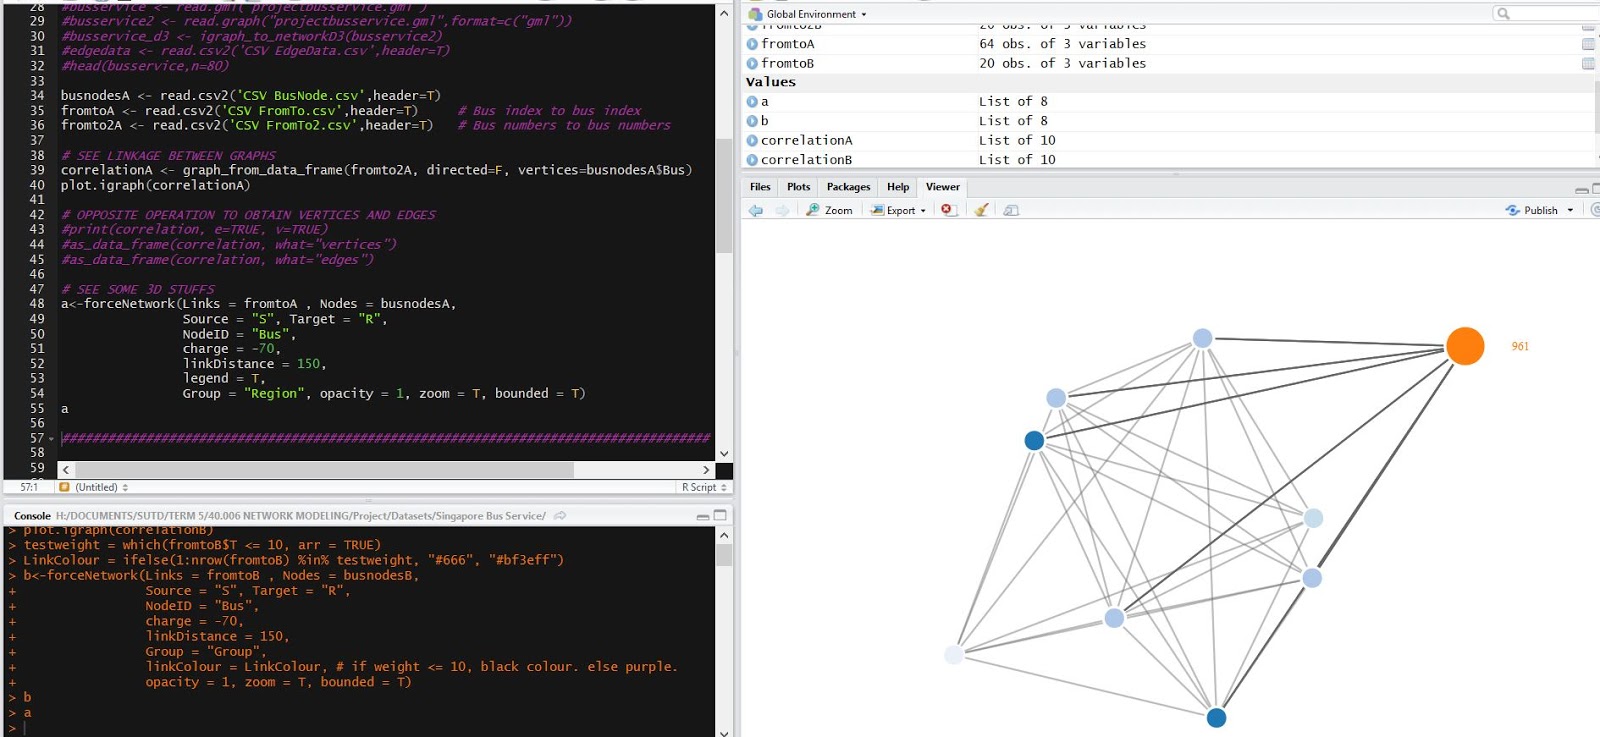
1. R Code


2. Centrality

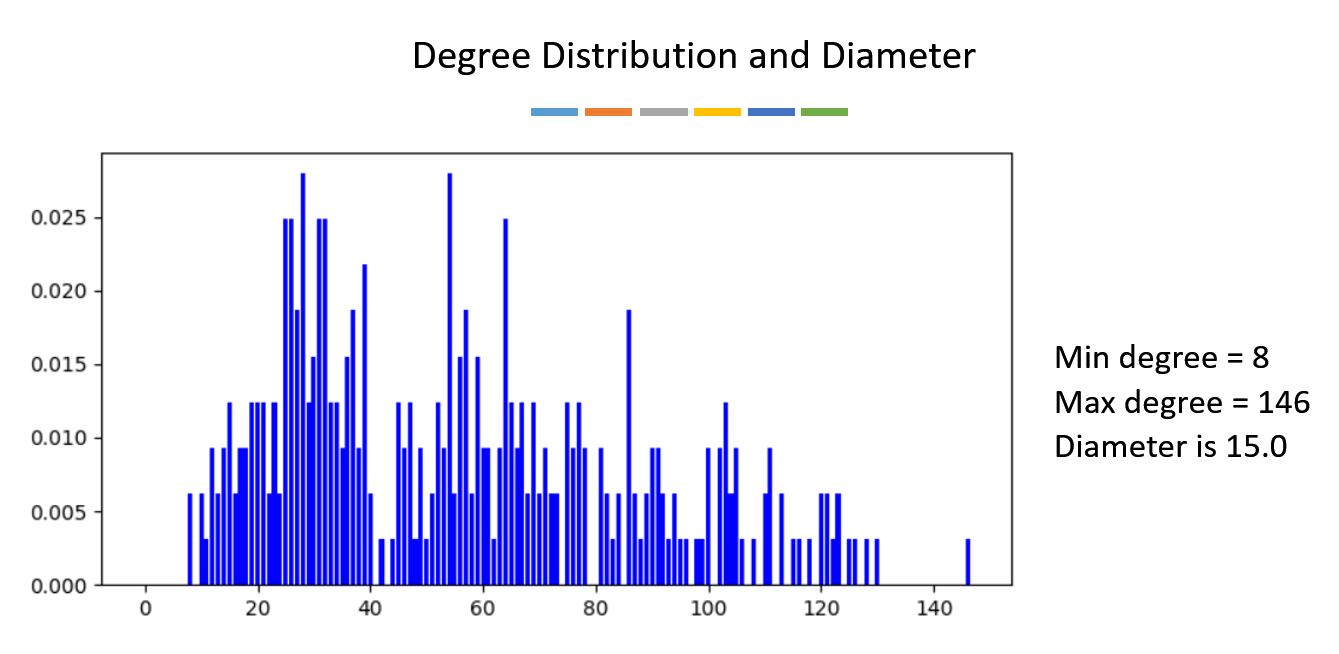
3. Degree Distribution and Diameter


4. Path

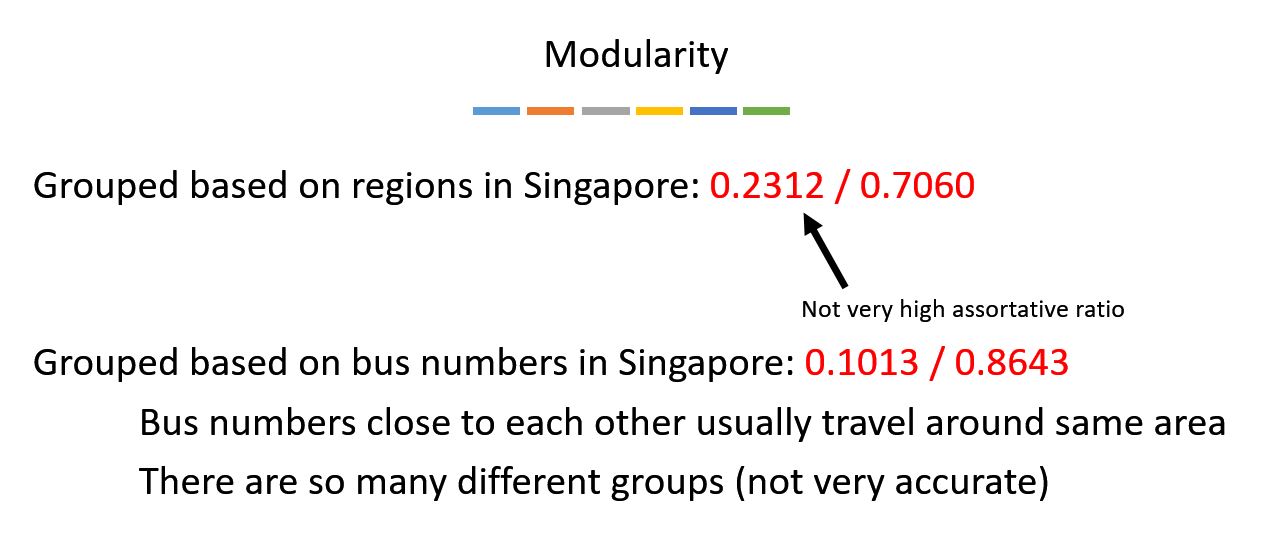
5. Modularity

Operations Management: YCH Group

Topic: Inventory Level Optimizing
Role: Project Member
Summary: Worked in a team of 5 to forecast demand to optimize inventory planning and restocking policy for a client of YCH, a supply chain company in Singapore
Tools: Python, R, ExtendSim
To forecast demand to optimize inventory planning and restocking policy
Problem: Company B, a client of YCH, faces stock-out of products due to unexpected demand which result in loss of sales. Also, they are not maximizing profit as they use a pure freight mode, air freight, which is expensive as they do not order in bulk.
Using R, the products that are most popular are identified and singled out for further analysis.
Using Python, by data visualisation, the same popular products corresponds to products that generate highest sales revenue.
Our proposed methodology includes
1. Remove obsolete products from warehouse
By removing obsolete inventory items that are in stock but have not been ordered for more than 2 years, this frees up more space in the warehouse for other fast moving products.
2. Identify and readjust the optimal PAR/order-up-to level
As Company B uses a PAR (Periodic Automatic Replacement) level model, a pull system inventory control, it employs a just-in-time concept. Loss of sales due to stock-outs can be reduced by readjusting the optimal PAR level.
Using statistical analysis, we realized the data of quantity order per day for each product fits a Poisson distribution.
By applying the poisson distributed demand, the optimal PAR level is obtained for different fill rate for each product.
3. Employ dual freight transportation
To reduce transportation cost for Company B, slow freight mode (shipping) can be introduced and used in complementary with the existing fast mode (air freight).
Using ExtendSim, the new model of increased par level and dual freight mode can be visualized.

Our suggested model prioritises shipping as the preferred choice of mode of delivery with par level 6. Unless inventory level drops below 4, air freight will be the preferred choice. Whereas Company B's existing model only consists of air freight mode of delivery and a par level of 5.
Running the simulation 10 times, there is significant transport cost savings ($2553 per product per year) and less occurrences of stock-outs. View the photos below to know more about our results.
Hover over thumbnail to enlarge image, click to open in new tab
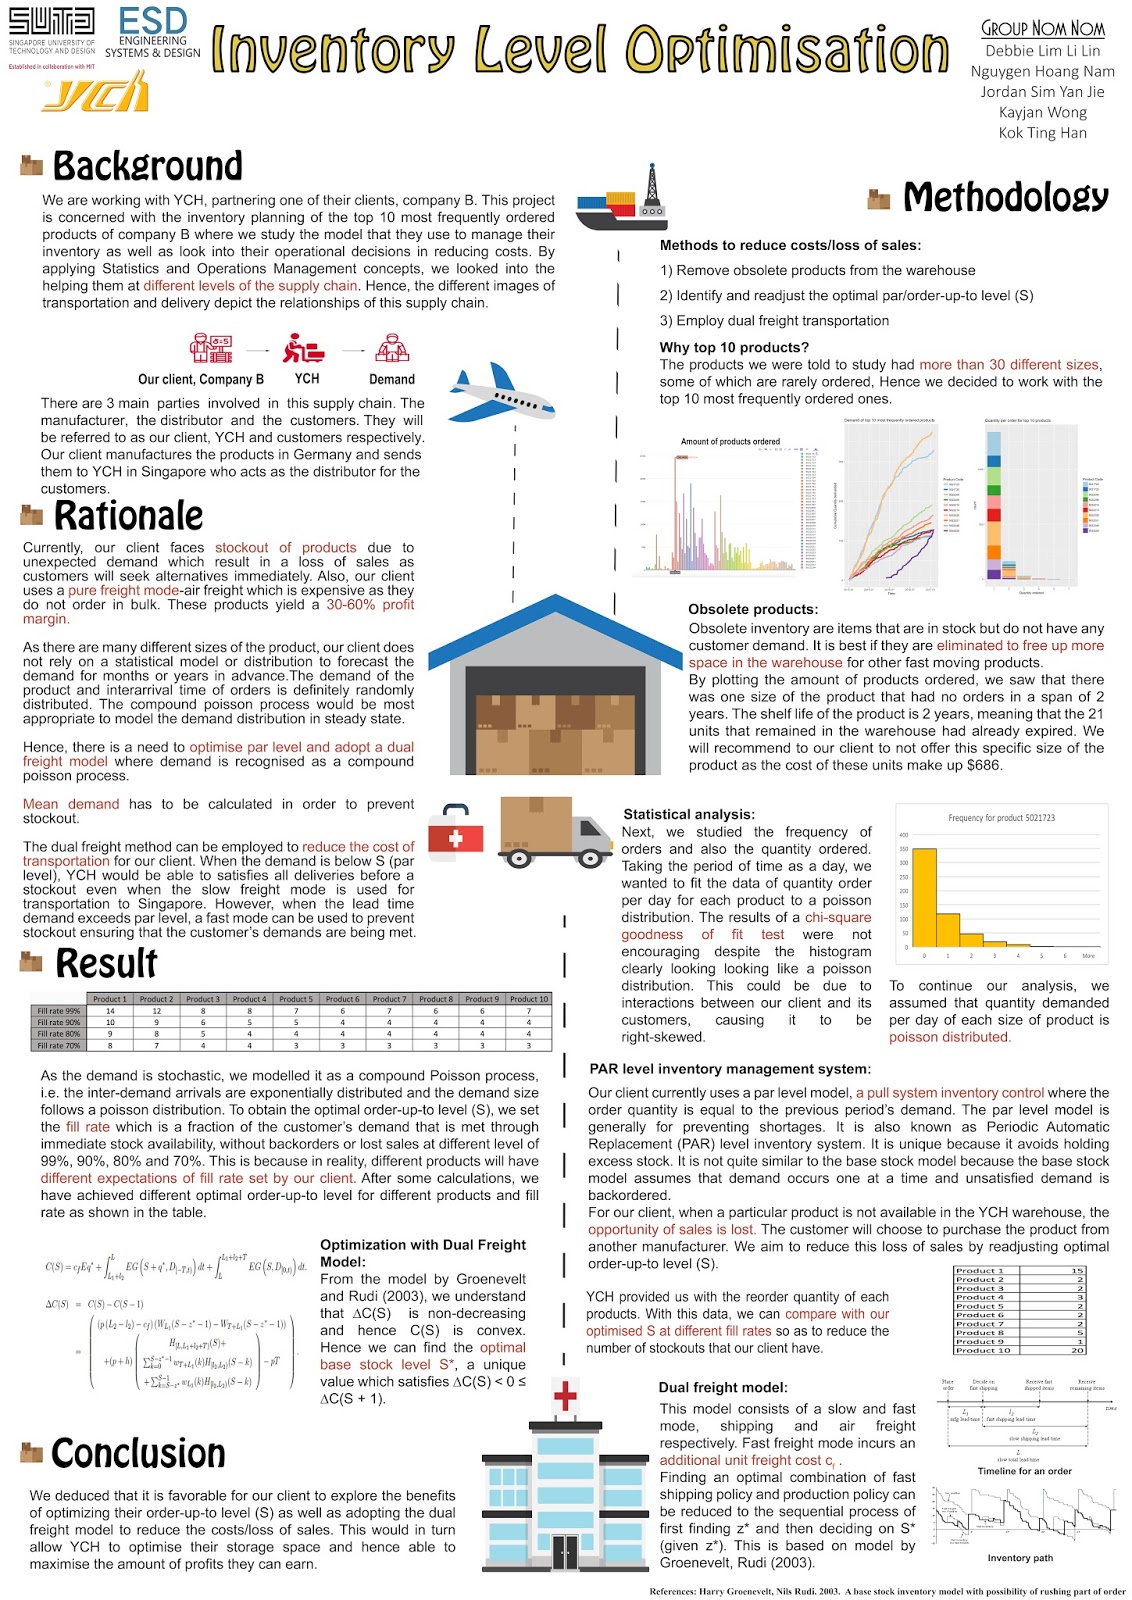
1. Poster

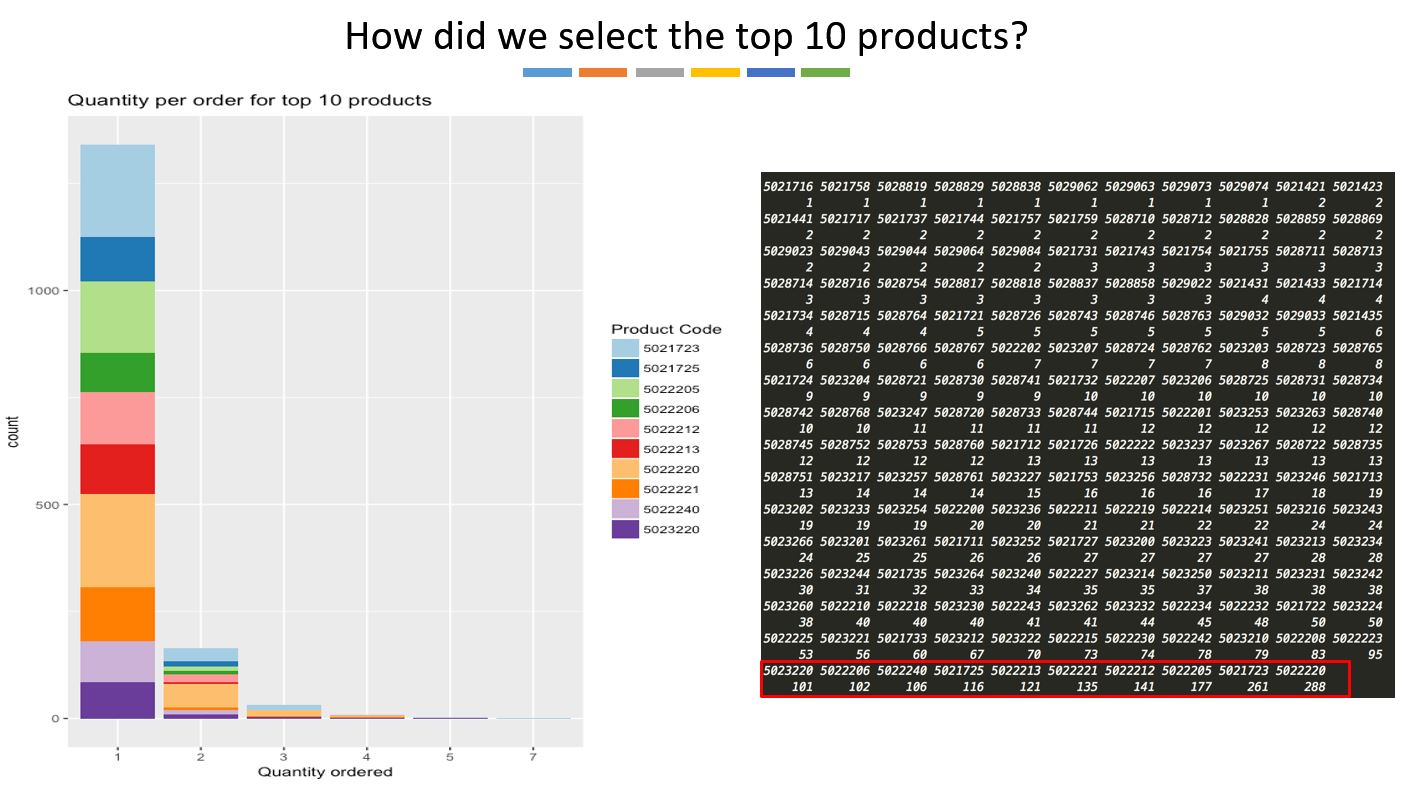
2. Product by Popularity

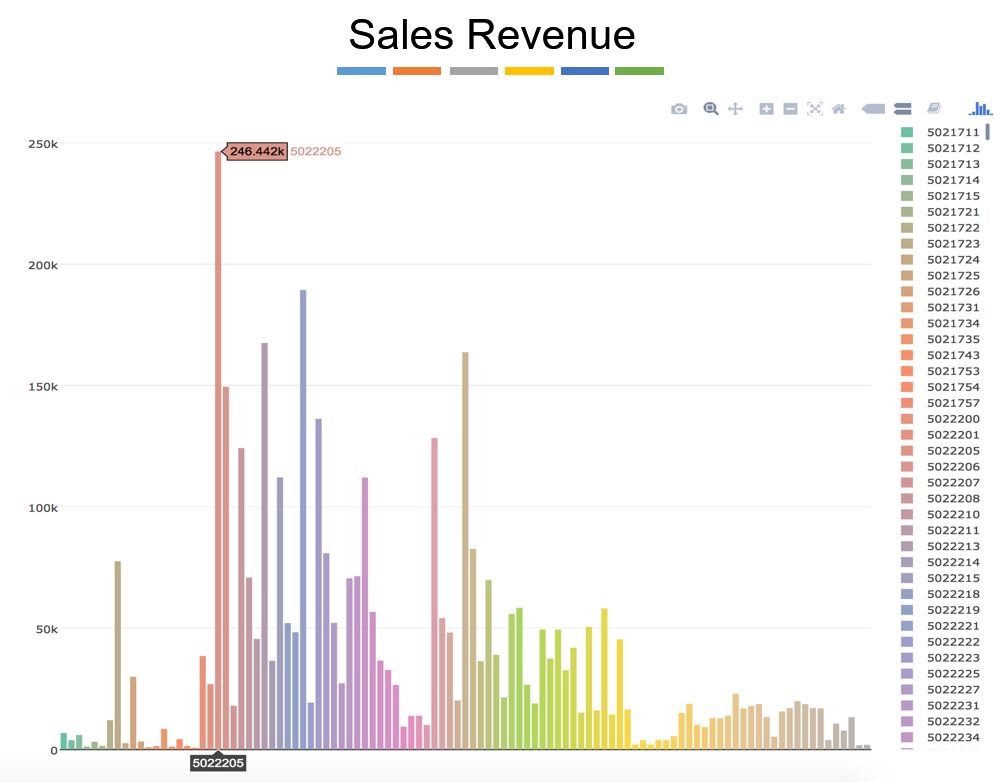
3. Product by Sales Revenue

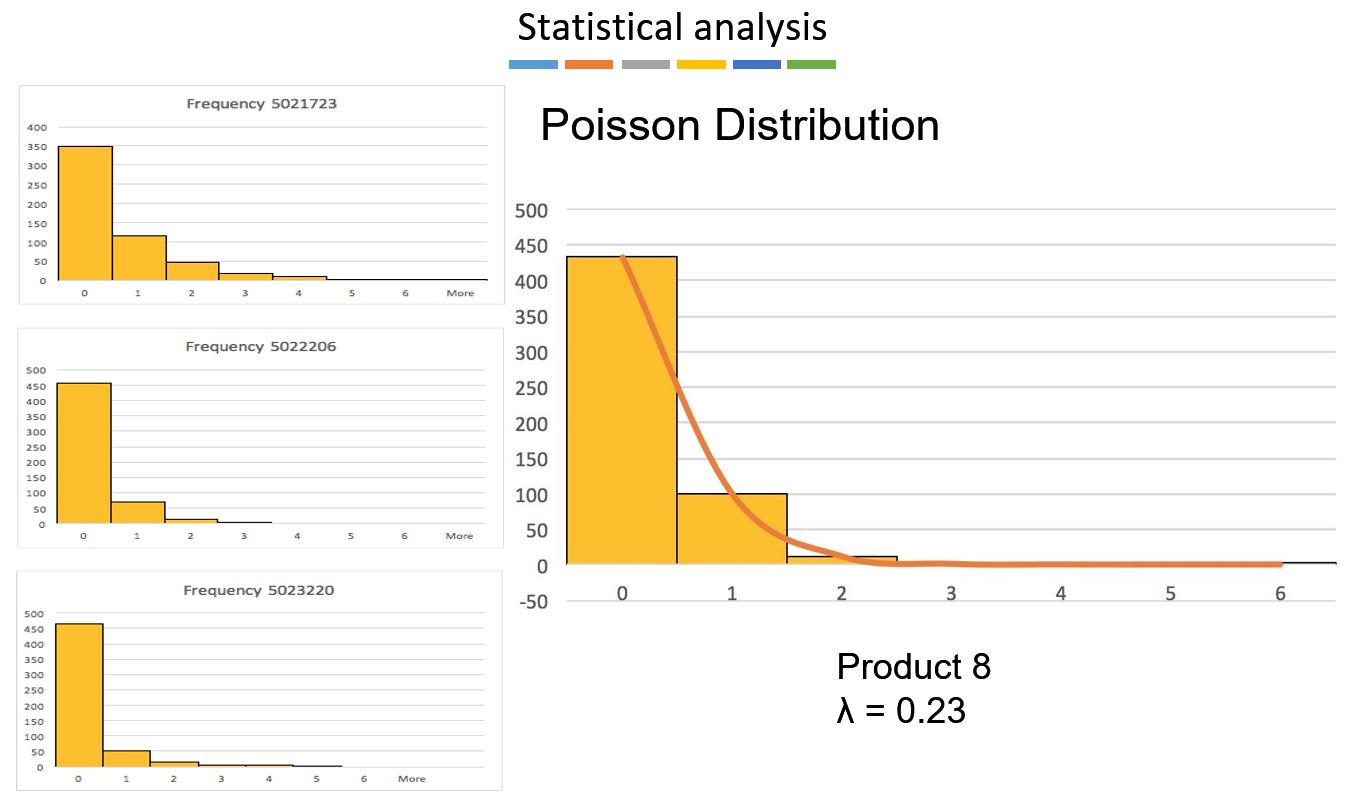
4. Poisson Distributed Demand


5. Adjusted vs Original PAR Level


6. ExtendSim Simulation

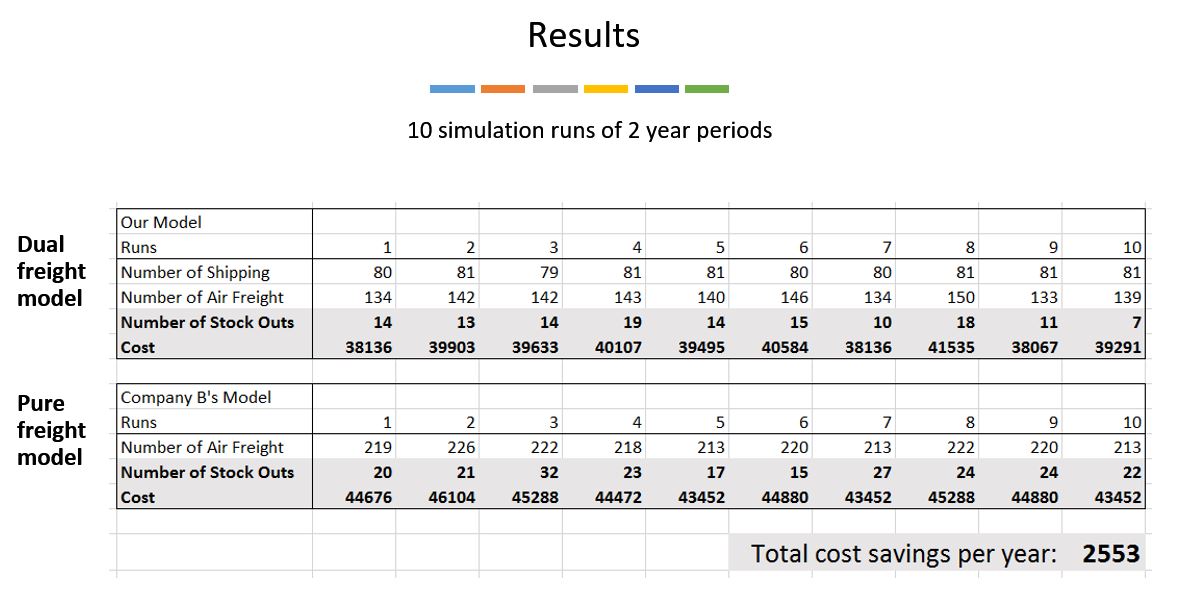
7. ExtendSim Simulation Results

Engineering Systems Design: Park Avenue Hotel

Topic: Maximising Revenue per Available Time-Based Unit
Role: Project Leader
Summary: Led a team of 4 to determine the ideal hotel rate based on occupancy rate forecast and other variables in order to maximize revenue for a hotel company in Singapore
Tools: SQL, R
To determine the ideal hotel rate based on occupancy rate forecast and other variables in order to maximize revenue.
Problem: Hotel prices are not set at the highest walkaway rate; the maximum price that will cause customers to 'walk away' and hence not maximizing their revenue.
From the preliminary analysis, irrelevant data is eliminated and there was a need to categorize data into weekdays and weekends. 70% of data is also assigned as 'training data' and 30% as 'testing data' to be able to test our final model.
Our data discovery findings:
1. Price and occupancy are not strongly correlated
Using R, the scatter diagram of room prices against occupancy yields an R-squared value of 0.07289, implying weak to no correlation.
2. Setting price using lowess function
Using R, a lowess function (scatter plot smoothing tool) calculates and plot the average price of each occupancy. This line is fairly straight and can be used as a guideline for base price or ceiling price.
3. Events are significant factor of room prices
Using R, the lowess function is applied again after splitting the data into 'Days with Events in Singapore' and 'Days without Events in Singapore'. The line is consistently higher across all occupancy rates when there are events in Singapore. The location of events also affect the room prices.
4. Month of the year does not affect room prices
5. Last week prices can act as a pricing guideline
6. Competitor prices can act as a pricing guideline
From all the factors affecting room prices, a spreadsheet is generated consisting of the lower bound / upper bound rates to set at for different days.
Improved pricing model at lower bound rates will give expected revenue increase of 4.2%.
Hover over thumbnail to enlarge image, click to open in new tab

1. Poster


2. Outline

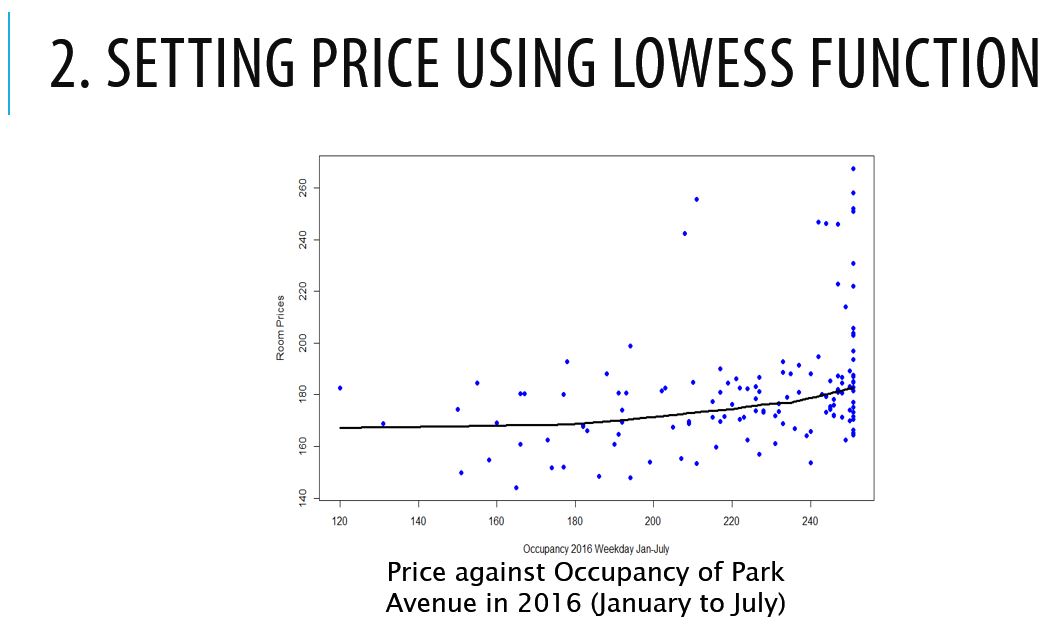
3. Room Rates with Lowess Function


4. Room Rates with Lowess Function filtered by Events


